|
JIDE TreeMap (Beta)
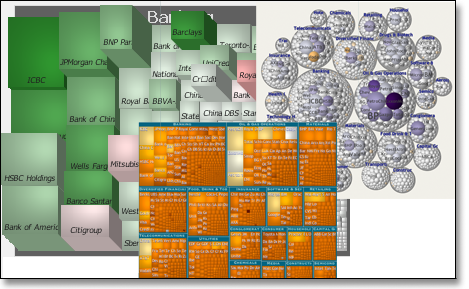
JIDE TreeMap is a Java/Swing implementation of the popular treemap visualization technique, invented by University of Maryland, College Park professor Ben Shneiderman in the early 1990s.
Treemaps graphically represent information about objects by dividing the display into areas (typically rectangles) that are proportional to the size of each object. By recursively nesting the areas, treemaps enable quantitative comparisons of attribute values while showing their hierarchical relationships. Typical examples include sales by region and by country, or number of defects by part and year, or budget by department and by division and by company, etc.
JIDE TreeMap comes with an extended set of features. The visual appearance of a treemap is highly configurable. Size, color, height, and labels can be mapped to any attribute. Many options allow you to further fine-tune the display. In terms of interaction, it provides a zooming interface as well as the possibility to drill-down. Details on demand are available in the form of pop-ups whose content can be freely customized. In addition to the classic treemap layout algorithm, JIDE TreeMap also features a number of alternative layouts such as a squarified variant that harmonizes aspect ratios of the rectangles, or the aesthetically pleasing circular layout. Maps can be rendered flat, or with a pseudo-3D shaded look with customizable light source.
JIDE TreeMap uses the common Swing TableModel as its data model to make integration with existing data sources easy. Adapting table models provided in JIDE Data Grids allow connection to JDBC result sets. A demo example also shows, how to connect a treemap with a live data source. The data can be grouped and aggregated by any combination of categorical attributes. Attribute values can be filtered numerically or by category. JIDE TreeMap is already useful with small datasets, but scales up to 100'000s of data objects.
  
|


