We designed JIDE Charts to:
- embrace the Swing MVC approach to offer maximum power and flexibility
- make it possible for a Swing developer to start working with charts within minutes
- generate great looking charts
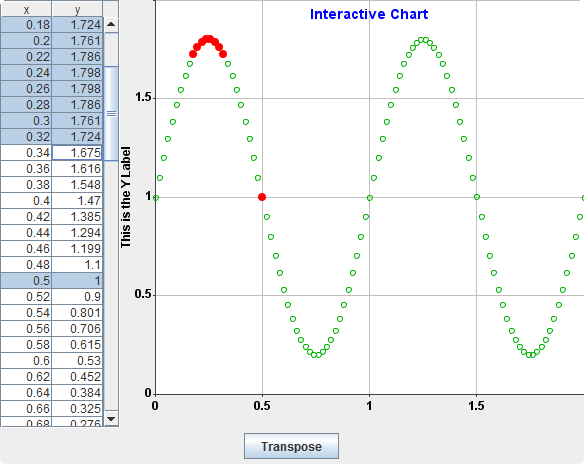
- support the interactive exploring of data
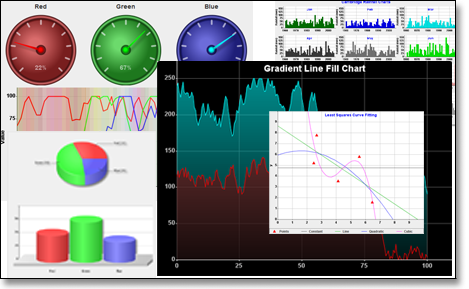


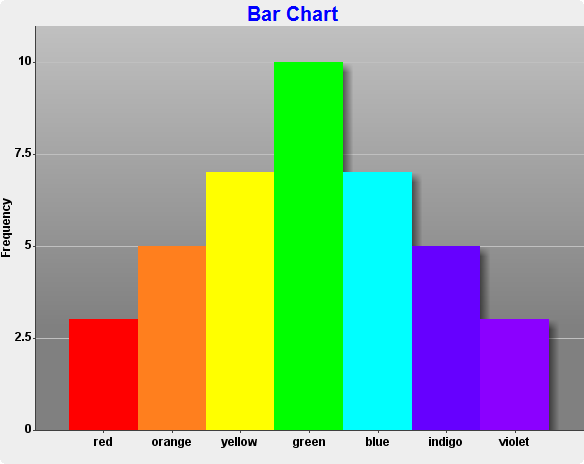
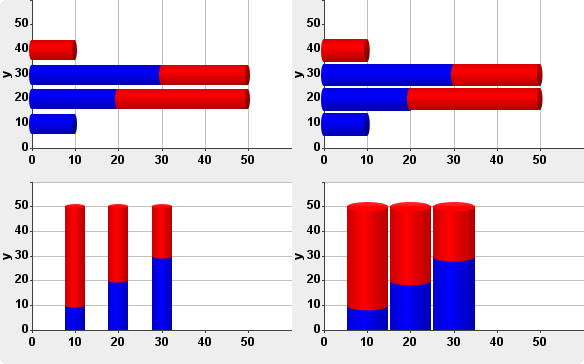
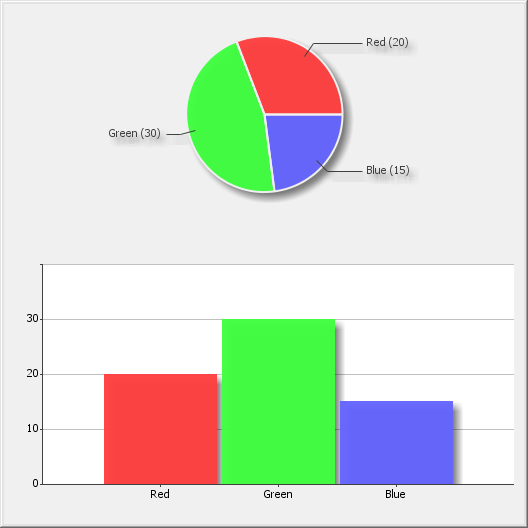
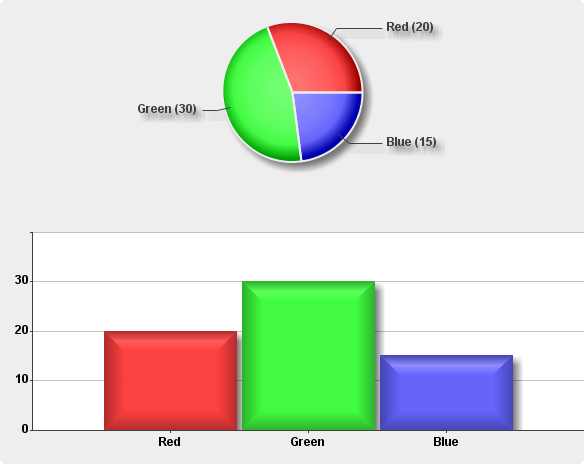
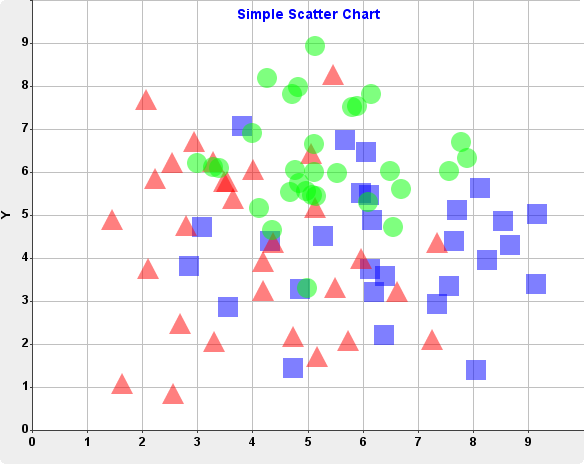
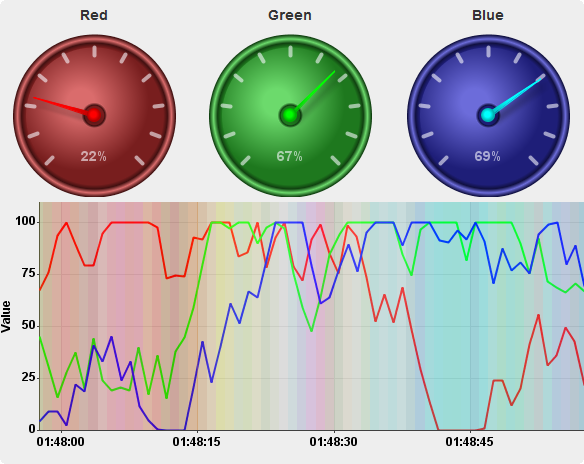
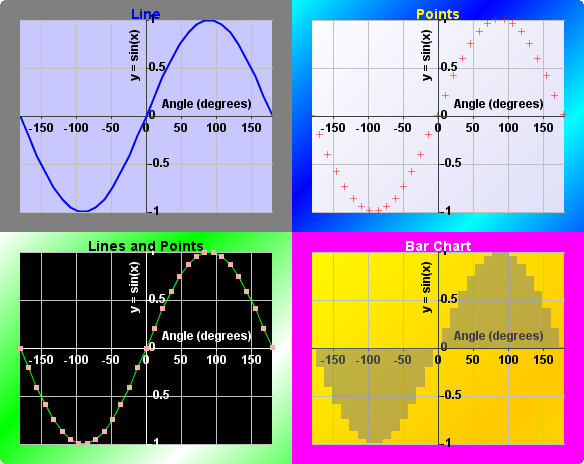
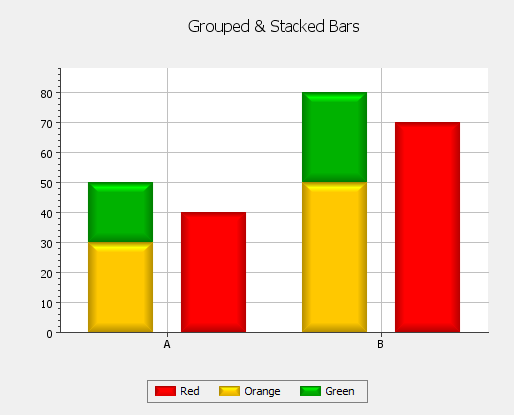
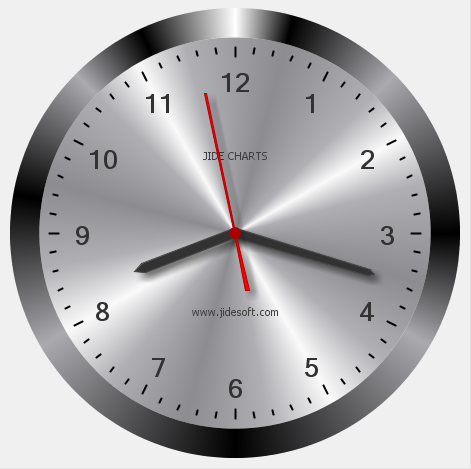
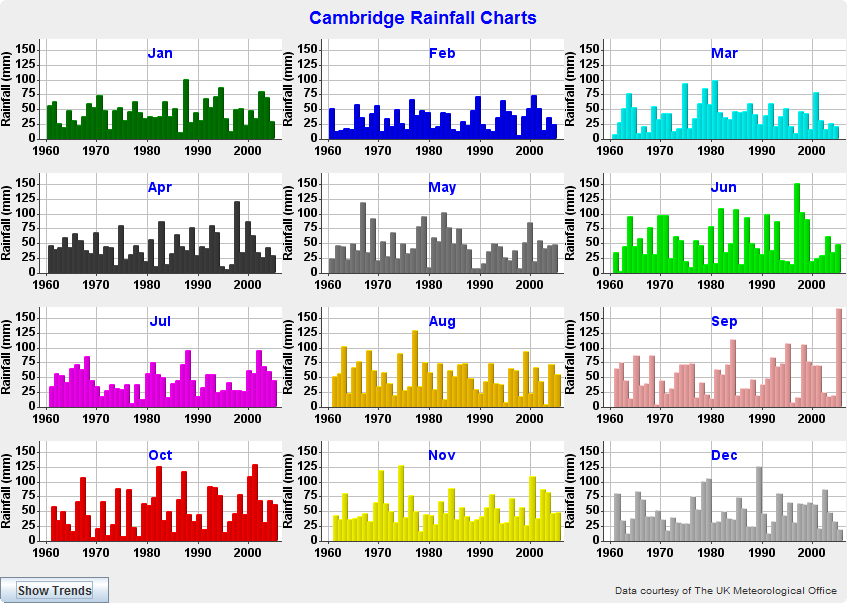
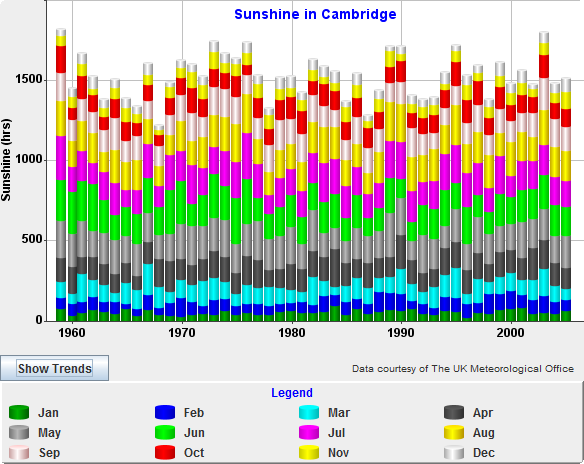
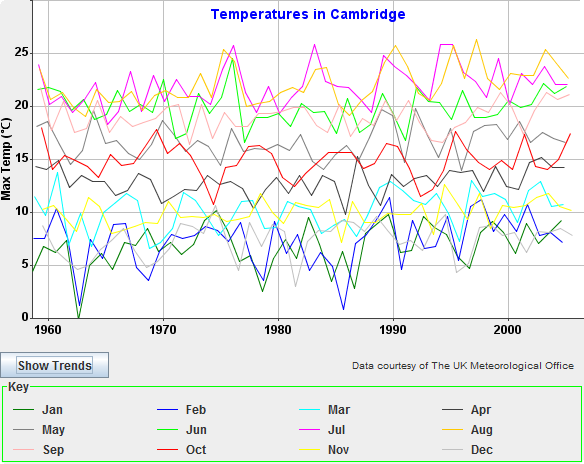
It supports many different chart types including line plots, scatter plots, bar charts, pie charts and even gauges. As you would expect, it embraces the model-view-controller pattern and has been designed so that you can easily switch from one visual paradigm to another - like switching from a bar chart to a pie chart - with minimal coding effort. As with JTable, the model layer is defined as an interface - which allows for custom implementations when advanced functionality is required - while the default implementation saves time and is very easy to use.
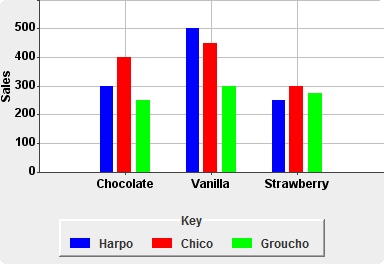
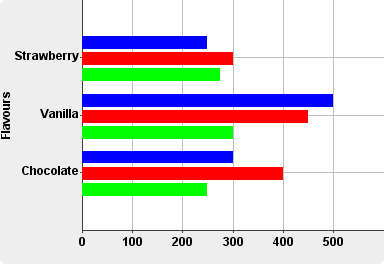
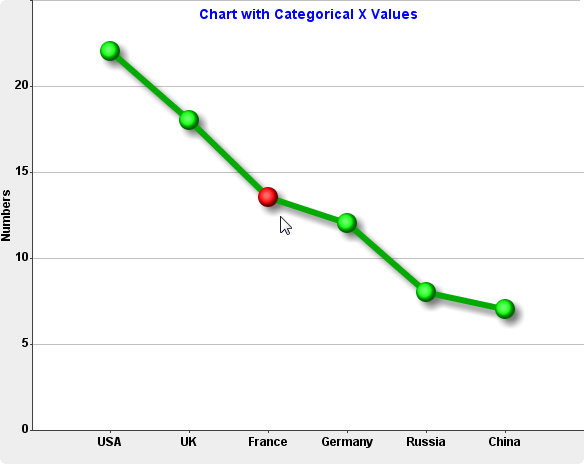
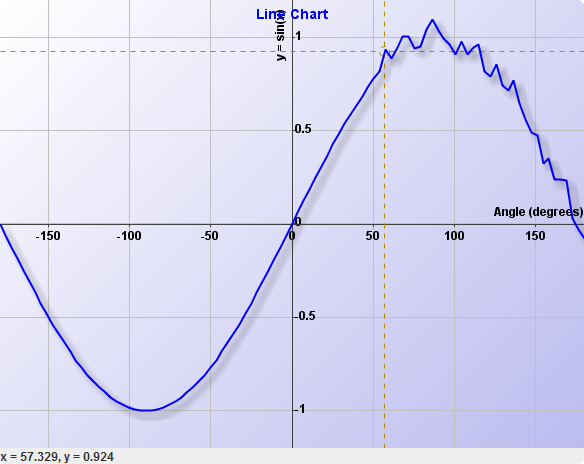
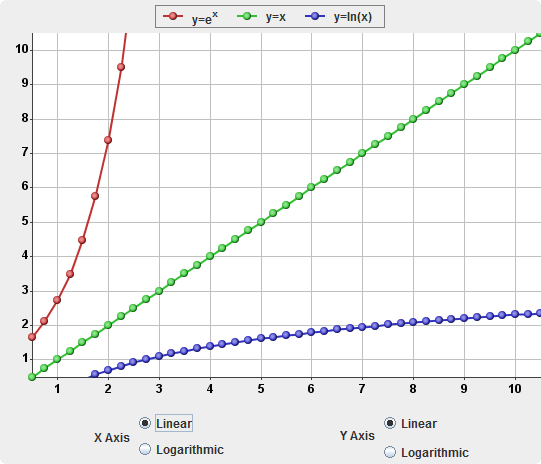
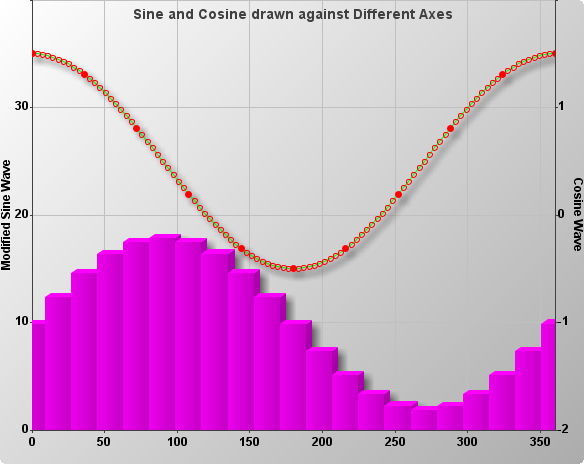
JIDE Charts supports axes for the display of numerical, time-series or categorical data. The concept of a category is very powerful because a Category instance can be created from any object - they do not have to be Strings or enums. So not only can you use an axis to display qualitative values (for example cold, tepid, warm, hot) but also to differentiate between different individuals in a model-driven coding effort. Axes are defined independently, so you can plot a numerical axis against time-series values, categorical against categorical, or any combination you choose.
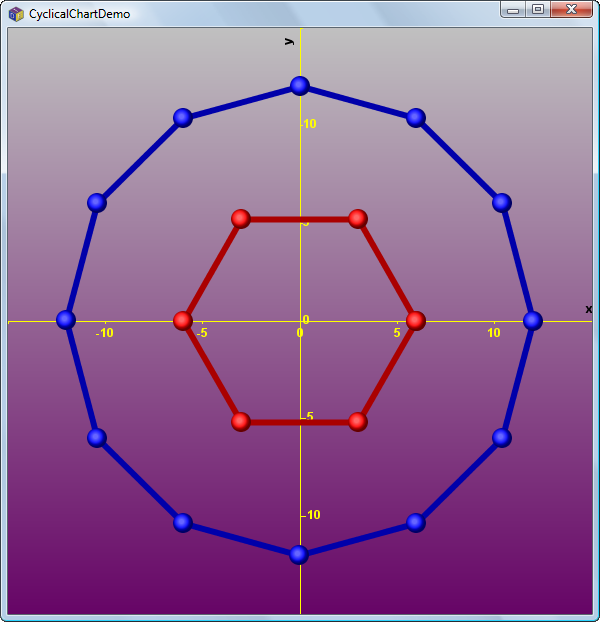
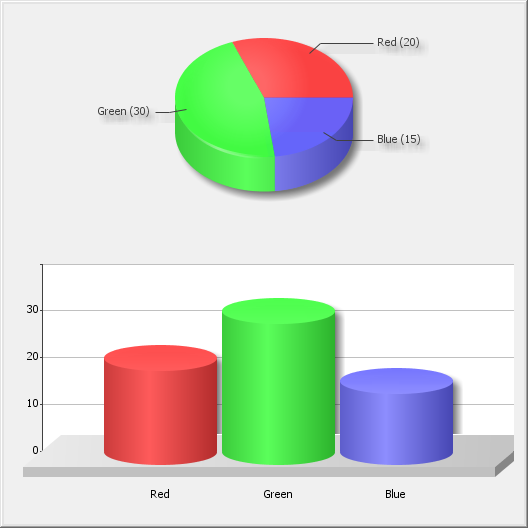
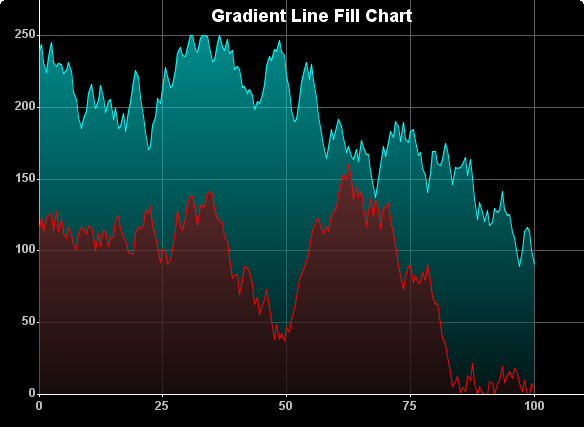
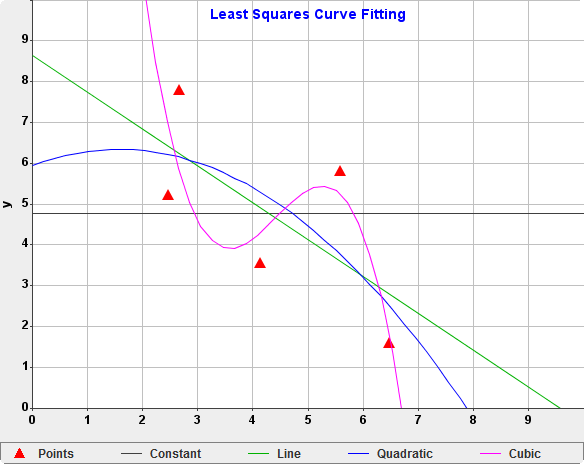
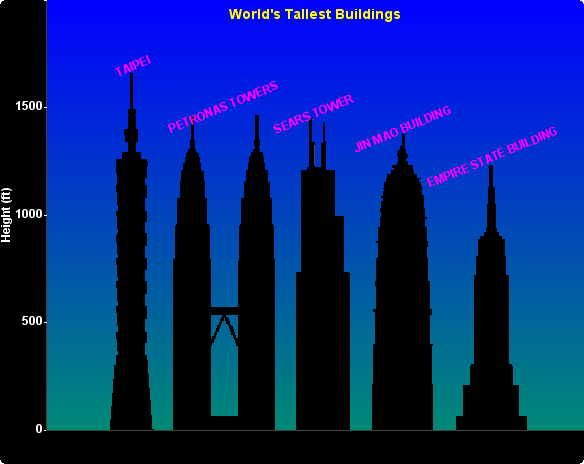
The visual appearance of charts is highly customizable with choice of colours, shapes and sizes or custom renderers. However, we have already designed some great looking renderers: the points of an XY plot can be rendered as shiny spheres, the bars of a bar chart can be displayed as glossy cylinders or 3d blocks; and a pie chart can be shown in a 3D style. You can easily switch on the intuitive data exploration gesture of zooming and panning with the mouse - all it takes is a single line of code. JIDE Charts supports multiple y axes and has special provision for displaying large datasets without the usual performance drawbacks. It even supports curve fitting for easily discovering the trends in data.