JIDE Gantt Chart

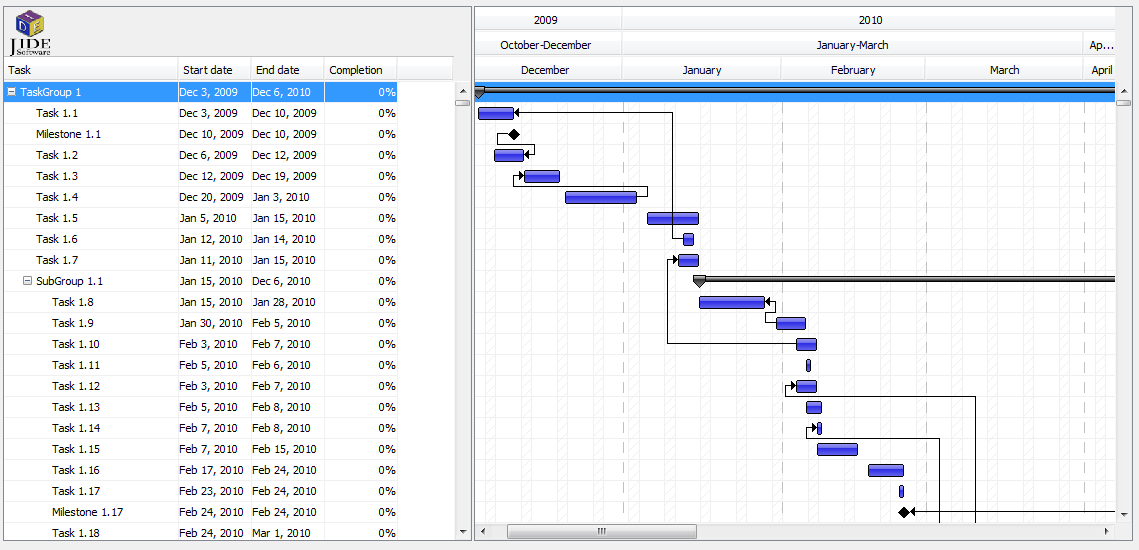
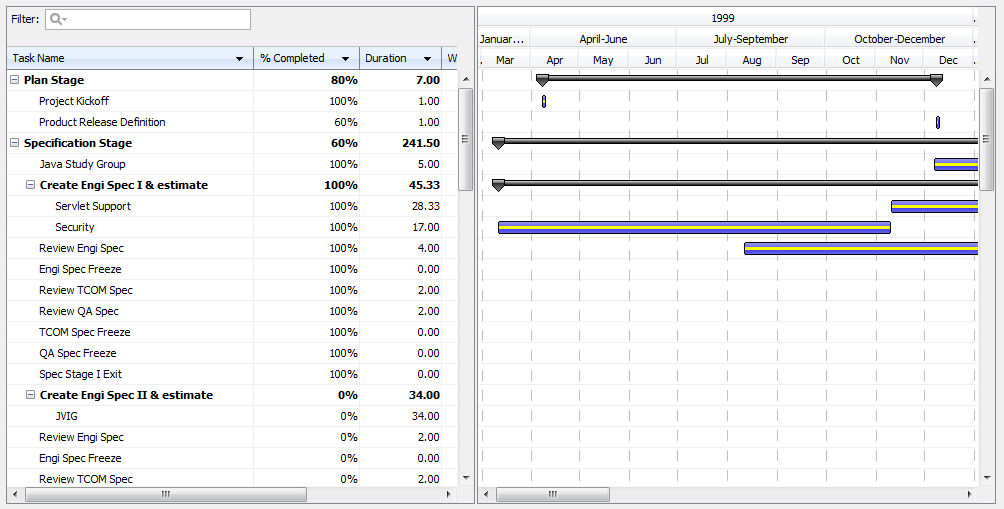
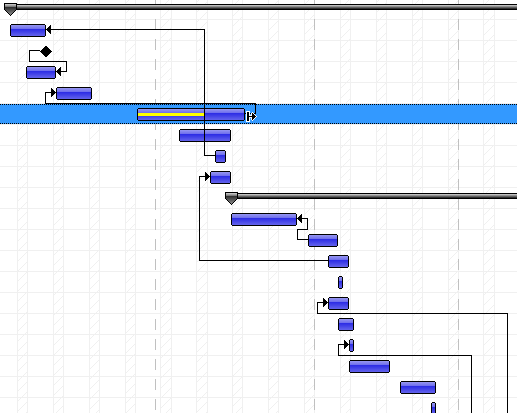
A Gantt chart is a graphical representation of the duration of tasks against the progression of time. It is a useful tool for planning and scheduling projects. A Gantt chart is helpful when monitoring a project's progress.

JIDE Gantt Chart is a pure Java Swing library that makes it possible to create a Gantt chart inside your Swing application. Just like many other components from JIDE, it provides all the basic features and a lot of APIs for you to further customize for your application.

Features

  • Tree table view and GanttChart view side by side.
  • Entry group supported.
  • Entry relationship supported.
  • Supports GanttEntryRenderer. User can write one's own renderer to render the Gantt entry and the entry group on the GanttChart.
  • Supports GanttLabelRenderer. User can write one's own renderer to render the label for the Gantt entry on the GanttChart.
  • Supports mouse interactive to change starting date, ending date and completion of the task entry
  • Keyboard navigation supported.
  • Multiple levels of periods on the scale area.
  • Period format support on the scale area.
  • Zoom in and zoom out.
  • Support both numeric and date as the period
Screenshots

GanttChart

Project GanttChart

Dragging a Task

Changing Percentage

Change Duration